
Time, place
Monday 8:15 am - 9:45 am; É7.57 (Small cmputer lab)
Thematic
In this course we get to know the mapping software QGIS and OCAD
Suggested reading The OCAD and QGIS documentation
Expectations
The lecture is absolved by creating two maps. You may get a total of 80 points. Please meet the deadlines. Each day of late submission results in a reduction of 1 point from your total score. Please send the map in PDF and all supplementary material compressed in a ZIP file via email: Usage of fancy file formats (e.g. RAR or 7Z) results in a reduction of 5 points, just like missing materials. The subject of the email should be: Cartographic software map 1 or 2. Please do not send any important messages alongside your maps, as I do not open such mails until all maps are submitted. Please put questions or write notes in a separate message with a different subject.
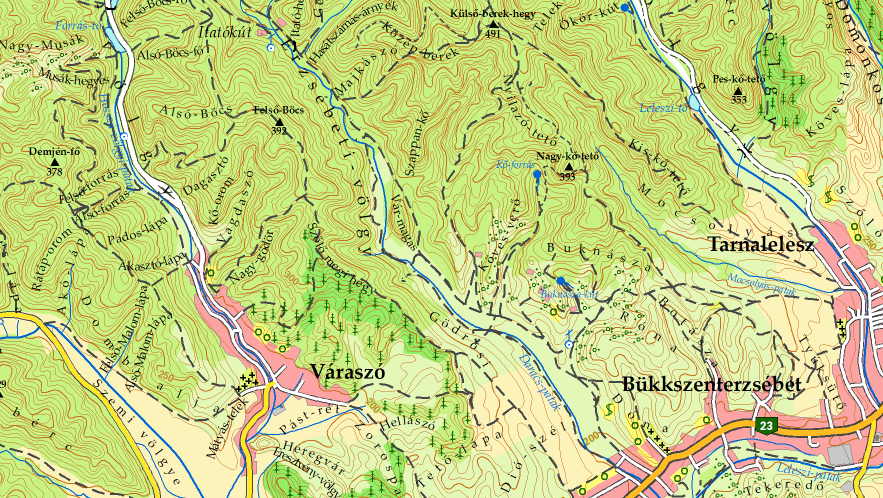
Map 1 [OCAD] (40 points) Deadline: 18th November 2019 10 pm- Choose an aerial photograph. Two students may not work on the same photo.
- You get outdated topographic maps. Georeference them. 2 points.
- Copy the contour lines from the old map. You should use brown or orange colour. Dashed lines must be drawn as a single line, and set dashes in OCAD. Use 0.15 mm width for normal contours and 0.25 mm for major contours. Do not use the straight line tool, use only curved lines. Write elevation numbers using the same colour, use scissors to hide contour lines behind. Point elevations should be in black. 6 points.
- Draw rivers, creeks and lakes from the aerial photo. You may use the old map as a help, but do not copy its content. Use curved lines. Linear waterways and shorelines should use exactly the same colour (dark blue or violet). The fill of lakes and rivers must use a light blue shade. The thickness of lines must be at least 0.15 mm. Write names in italics, copy names as you see on the old map. Beware of correct spelling and accented characters. You may use any font of minimum 5 pt maximum 8 pt size. Font colour should be exactly the same shade as that of the rivers. Write names of lakes horizontally, names of rivers alongside them. When unsure on what you see on the photo, you may use Google Maps. 6 points
- Draw land usage as you see on the aerial photograph. Do not copy any land usage content from the old map. Use Google street view if you are unsure what you see on the photo. 12 points
- Agricultural lands, crop, etc.: very light yellow (almost white). Use one fill independently of what crop you see on the photograph. Best to create a big rectangle, and mask out non-agricultural land. Do not use different colours for different kinds of crops, even if they do not look similar on the aerial photo.
- Grass, meadow: light green.
- Forest: not so light (but not harsh) green
- Vineyards, orchards (fruit trees): light yellow or light green with green symbols.
- Residential (built in) areas: light orange or light pink fill with 0.15 mm grey, orange, or pink boundary. Use straight lines for the boundary. Do not draw houses or blocks separately but draw only one single polygon for each village. You may only draw separate buildings at farms. Fill industrial areas (e. g. factory, military area) with light grey. Names of the settlements: bold, upright font (beware of accented characters), You may place the name anywhere around the settlement but not inside it.
- Gardens: light yellow.
- Draw roads as you see on the aerial photograph. Do not copy roads from the old map. Use Google street view if you are unsure what you see on the photo. 8 points
- Motorway: Triple line. Beware of overpasses and underpasses. Curved lines.
- Motorway junction branch: Same colour as the motorway but double line. Curved lines. Draw all branches.
- Main roads: 0.8-1.3 mm yellow or orange fill, 0.2 mm red or grey border.
- Other paved roads, streets: 0.5-1 mm white fill, 0.15 mm grey border. You may also use straight lines.
- Unpaved roads: 0.3 mm dashed grey lines.
- Draw railways with dark grey line with white dashes. Curved lines. 2 point
- Copy areal names from the old map as line text symbol. Beware of correct spelling, one name should be in one text object. The letters do not have to be in exactly the same position as the original. 3 points
- You should not copy other contents (not mentioned in this description) from the old map.
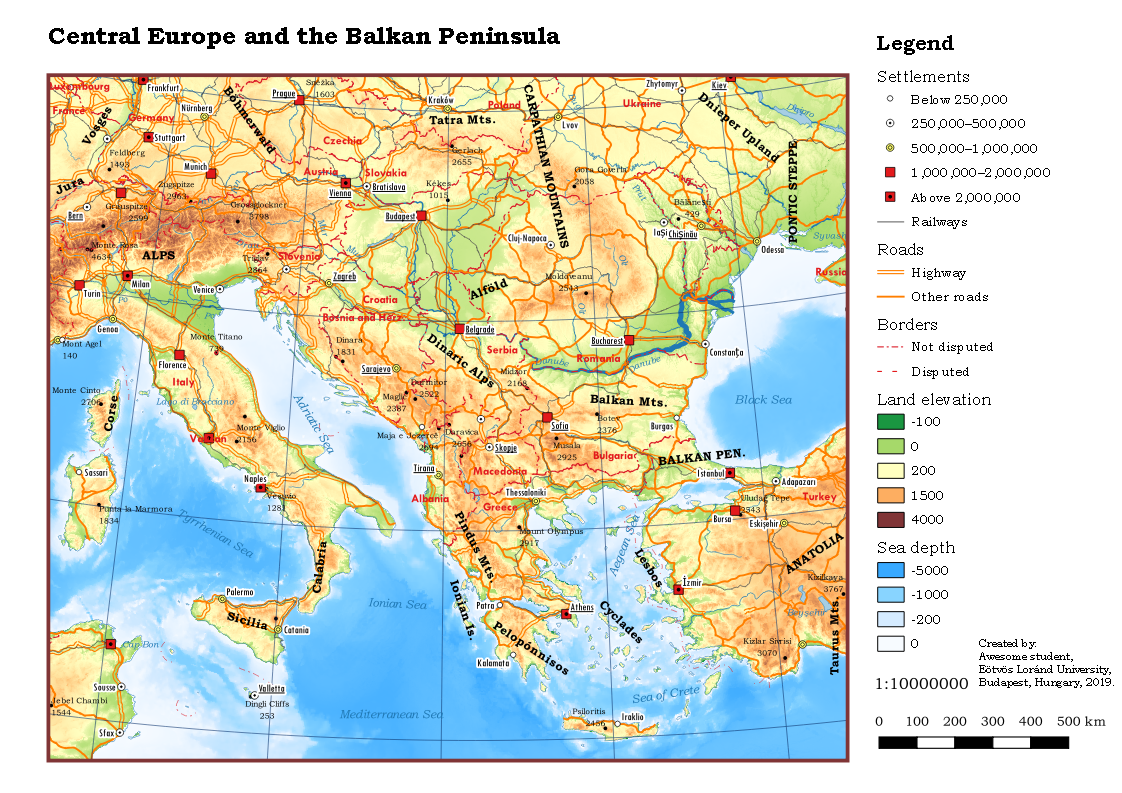
Map 2 [QGIS] (40 points) Deadline: 16th December 2019 10 pm
- Choose a geographic area. Two students may not draw maps of the same area.
- Crop the Natural Earth data set to your region, and save it to a geopackage. You should keep a bit greater area in the database than necessary. 3 points
- Choose an appropriate map projection for your QGIS project. 2 points
- Display settlements with scalerank ≤ 6. Categorize settlements according to their population (field max_pop) into at least five categories. Use round numbers for category boundaries. Use symbols that express the population differences between the settlements: circle, dot in circle, circle in circle, square etc. You may give further emphasis by color fill (white, yellow, red) and size. Minimum and maximum allowed diameters are 1.5 and 3 mm, respectively; use bigger symbols for larger cities. Write names using a black, upright, condensed font of minimum 6 pt maximum 9 pt size. Underline capitals. You may use any language present in the database but all features must be labeled in the same language. 8 points
- Display rivers, lakes, and shorelines. Rivers, shorelines and lake borders should use exactly the same colour (dark blue or violet). The fill of lakes must use a light blue shade. The thickness of rivers must vary with the field strokeweight, shorelines of lakes and oceans must be 0.15 mm wide. (See figure.) Write names in italics. You may use any font of minimum 5 pt maximum 8 pt size. Font colour should be exactly the same shade as that of the rivers. Write names of lakes horizontally, names of rivers alongside them (allow both sides), names of seas (separate layer in the dataset) inside the seas. 7 points
- Create a hypsometric colour from the ETOPO1 model. Use different colour schemes for oceans and lands. Oceans: the deeper, the darker blue (but do not use harsh colours); lowlands: light green; hills: yellow; mountains: brown. Mountains higher than 3000 m may also be displayed in white. Label the geographic regions using an upright, bold, black font. 5 points.
- Display country borders using thick (0.25-0.5 mm) red or purple dashed lines. Use a different dash pattern for disputed borders, thinner lines for sea boundaries (maritime indicators in the dataset). Write the names of the countries inside them using an upright font of size 7-10 pt. You may use black colour or the same shade you chose for the borders. 5 points
- Include a basic transportation network (railways in grey, and roads) with scalerank ≤ 6. Use simple symbols. Motorways should use a different symbol than other roads. 4 points
- Fit your map in a 1 : 10 000 000 scale on an A/4 size paper. Include a legend. If your map is not in English, provide a bilingual legend (your language and English). Start legend labels with capital letters, consider the English spelling rules. Remove unnecessary entries from the legend. Include title, scale, scalebar, graticule (in blue) and publishing data (your name, place and year of creation). 6 points
Visiting the seminar
Visiting the seminar is compulsory; however, one may be absent from three lessons without any explanation. Whoever is not present at least for four sessions, may not absolve the lecture. Late arrival (exceeding 15 min) is also logged. Should one arrive late three times, it will be considered as a missed session. Please note that excuses like “I was not here on the last session” are not accepted. Please always consult your classmates after missing or delaying from a session.